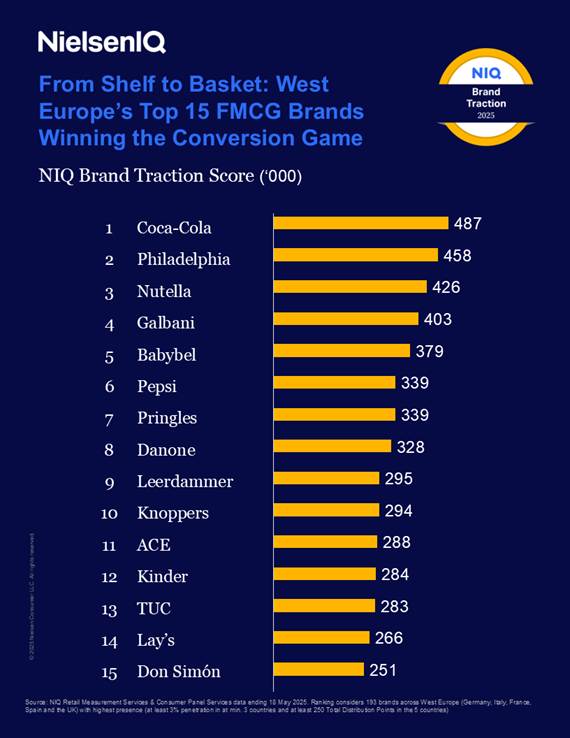
- Coca-Cola, Philadelphia and Nutella rank highest among the top 15 FMCG brands that have the highest traction score in Western Europe
- The higher the score, the more effectively a brand not only reaches consumers but also converts visibility into sales
- NIQ also highlights a growing trend across Europe, where rising brand traction scores are closely aligned with the strongest sales growth
Coca-Cola has been recognised as the top FMCG brand in Western Europe for its success in driving conversions, according to NielsenIQ (NIQ)’s Brand Traction Score, a new metric that measures how effectively brands convert their shelf presence into actual consumer purchases.
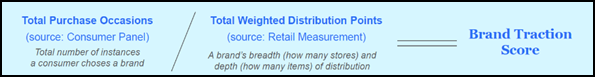
The NIQ Brand Traction Score combines two of NIQ´s most powerful data sources: insights from its Consumer Panel, which tracks how frequently shoppers buy a brand, and its Retail Measurement data, which captures how widely and deeply that brand is distributed across stores.
This strategy saw some of the top-performing brands grow by 40% due to expanding their presence, with more than 60% of their unit growth coming from households adding these brands to their category repertoire. There was also growth (18%) from existing buyers expanding their brand and category purchases, while only a third of total growth came from competitive steal.
Brands with a high Brand Traction Score tend to be larger, faster-growing, and more efficient at converting visibility into sales. With NIQ’s Brand Traction Score, FMCG manufacturers can break down the drivers of brand growth and identify marketing and trade optimisation opportunities.
From indulgence to dairy: categories driving traction
NIQ’s analysis revealed that within Western Europe – which includes the UK, Germany, France, Spain and Italy – Coca-Cola is the brand with the highest traction, with a score of 4871.
Coca-Cola was closely followed by cream cheese brand Philadelphia (458), with Nutella (426) taking third place. Among the top 15, indulgent brands lead, followed by dairy – both categories have benefited from broad product portfolios, versatile usage occasions and shorter purchase cycles. Apart from established international brands, we also see a representation of strong local players and category specialists within the top 15 ranking.
 Out of 446 European brands (49%) that managed to grow significantly in unit sales (+5% or more), 81% managed to win over both shoppers and retailers, boosting their appeal on both sides of the shelf 2. Additionally, 60% of these brands grew their brand traction, meaning that their additional listings resulted in proportionately more frequent purchases by more shoppers.
The proof is in the Brand Traction pudding
Across all seven FMCG sectors analysed, the data reveals a consistent pattern: the brands achieving the strongest unit sales growth are also those seeing the greatest increases in brand traction. This underscores that while distribution remains a crucial area for growth, success ultimately depends on prioritising the right products (new or existing) that can more effectively convert shelf presence into sales.
Brands that grow their Brand Traction Score the most and achieve sales growth stand out by investing in what Western European shoppers care about most during a period of economic uncertainty: everyday affordability, healthier choices and sustainable options. By expanding into adjacent categories and launching new products that meet these needs, they are successfully strengthening their presence on the shelf and at the same time expanding the consumption of their brand and their parent category in more households, more often.
Emilie Darolles, President Western Europe, NIQ said: “The Brand Traction Score is a powerful new metric that reveals how effectively brands turn shelf presence into real purchases. We’ve seen brands that didn’t expand their physical availability still grow sales by strengthening their brand traction, proving that growth isn’t just about gaining new buyers – it’s about converting them more often.”
Darolles Adds: “In Western Europe’s highly competitive market, this composite metric brings together NIQ’s integrated data sources to provide the Full View™, giving manufacturers a clear and actionable read on growth opportunities, and enabling brands to improve conversion, enhance in-store performance, and drive sustainable growth.”
1 Examined among 446 brands with at least 1% penetration in EU5 that grew in terms of unit sales by +5% or more in the past year ending May 2025 compared to year ago
2 This analysis combines Retail and Panel data for the year ending May 2025, providing a more robust assessment of brands performance (based on Retail sales data) as well as a more comprehensive understanding of what makes international brands grow.
Comments are closed.